 cagatayuresin
KubeOwl: Agentic RAG for Kubernetes Operations
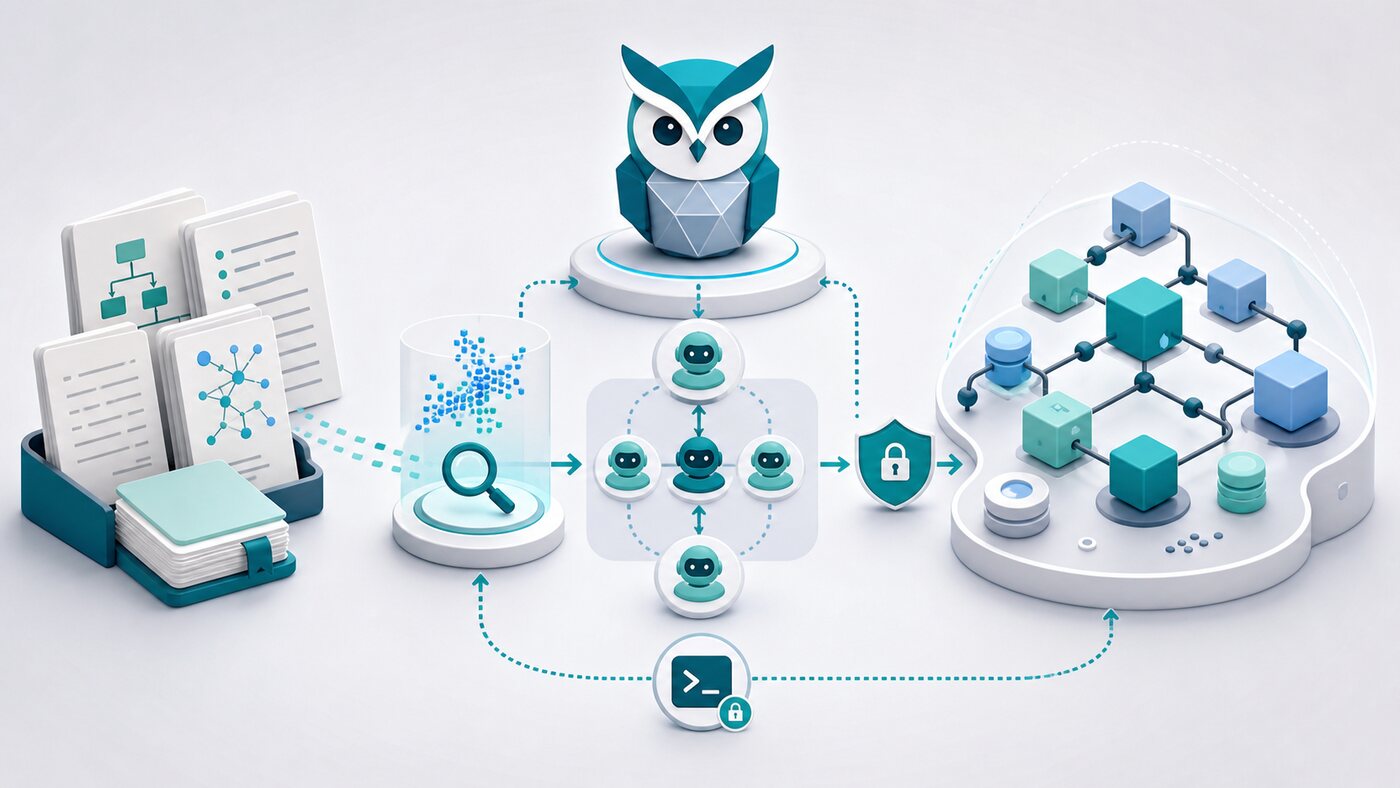
KubeOwl is an AI-powered Kubernetes operations assistant that helps diagnose cluster problems, search your own runbooks, inspect live state through safe read-only commands, and turn the findings into concrete remediation steps. I built it for the gap between static documentation and real incident response: Kubernetes failures often require both tribal runbook knowledge and current cluster evidence.
The project combines a FastAPI backend, a single-page web UI, LlamaIndex ReAct agents, ChromaDB, BM25 keyword retrieval, vector search, and a restricted kubectl tool. It can run locally against your kubeconfig or inspect a remote Kubernetes host over SSH. The default provider is Ollama, so you can keep the whole workflow local, but KubeOwl can also use Gemini, Claude, OpenAI, or a remote Ollama instance.
KubeOwl is not an autonomous remediation bot. It does not apply manifests, delete pods, scale deployments, or mutate your cluster. Its job is to act like a careful operations copilot: read the symptoms, retrieve relevant runbook guidance, gather safe evidence, explain what is likely happening, and show the exact commands a human operator can choose to run.
GitHub repository: cagatayuresin/kube-owl
What problem KubeOwl solves
Kubernetes troubleshooting usually starts with the same questions:
- Which object is failing?
- Is this compute, network, storage, scheduling, or image pull related?
- What did the Events section say?
- Are there logs that confirm the failure mode?
- Does the team already have a runbook for this?
- Which command should be run next?
Generic LLM chat can help with broad explanations, but it does not know your runbooks and it should not guess about the live cluster. Traditional runbooks help, but they do not automatically adapt to the current namespace, pod, node, PVC, service, or event stream.
KubeOwl sits between those two approaches. It gives the model access to indexed runbooks and to a deliberately constrained kubectl interface. That lets it answer questions such as:
Pods in the production namespace keep restarting. What could be wrong?

I am getting ImagePullBackOff in staging. What should I check?

Node worker-2 is NotReady. What is the safest diagnosis path?

A PVC is stuck in Pending. Is this a StorageClass problem?
The result is a diagnosis flow that is grounded in documents and cluster state instead of a free-form answer built from memory alone.
Core capabilities
KubeOwl focuses on common Kubernetes operations issues:
CrashLoopBackOffOOMKilledImagePullBackOffNode NotReady- pod scheduling and
Pendingstates - disk pressure and evictions
- PVC, PV, and StorageClass failures
- Service, endpoint, Ingress, DNS, and NetworkPolicy problems
The repository ships with starter runbooks for these topics under runbooks/, and the UI lets you upload your own .md, .txt, or .pdf runbooks. Uploaded documents are chunked, embedded, stored in ChromaDB, and tracked in a local document catalog.
The web interface includes:
- chat-based Kubernetes diagnosis
- provider selection
- runbook upload and document management
- optional multi-turn sessions
- optional Server-Sent Events streaming for agent steps
- Kubernetes connection status
- local kubeconfig mode or remote SSH session mode
- an optional web terminal guarded by the same read-only command validator
Architecture
At a high level, KubeOwl uses a supervisor agent and three domain specialists. The supervisor reads the user question and routes it to the right expert: compute, network, or storage. Each specialist can search runbooks and inspect the cluster through the safe kubectl_exec tool.
User question
  -> FastAPI backend
  -> Supervisor ReAct agent
      -> Compute specialist   -> search_runbooks + kubectl_exec
      -> Network specialist   -> search_runbooks + kubectl_exec
      -> Storage specialist   -> search_runbooks + kubectl_exec
      -> Direct runbook search when the domain is unclear
  -> Structured answer with findings, sources, provider, model, and steps
The backend caches constructed agents per provider, so repeated queries do not rebuild the entire agent tree. The kubectl tool resolves the active execution mode per call, which means it can target the local environment or a selected SSH session.
This separation matters. A Service with no endpoints should not be diagnosed the same way as an OOMKilled pod. A PVC stuck in Pending needs a storage-first investigation path. A node readiness issue may require compute and storage context. Splitting the reasoning into specialists keeps the prompts narrower and the final answer more operational.
Hybrid RAG over Kubernetes runbooks
Kubernetes incident text often contains exact tokens that are easy to miss with semantic search alone. Examples include OOMKilled, 137, ImagePullBackOff, Endpoints: <none>, and DiskPressure.
KubeOwl uses hybrid retrieval for that reason:
- Markdown runbooks are parsed with Markdown-aware chunking.
- Other text is split with sentence-based chunking.
- Chunks are embedded and stored in ChromaDB.
- BM25 handles exact keyword matches.
- Vector search handles semantic similarity.
- Results are fused with reciprocal-rank retrieval.
The retrieval pipeline looks like this:
Uploaded runbook
  -> validation and safe file storage
  -> Markdown or sentence chunking
  -> embeddings from the active provider
  -> ChromaDB persistent collection
  -> BM25 node cache
  -> hybrid retrieval at query time
This helps KubeOwl find both literal and conceptual matches. If the user asks about exit code 137, BM25 can catch the exact token. If the user asks why a workload “keeps getting killed under memory pressure”, vector search can still retrieve the OOMKilled runbook.
One important operational detail: documents are embedded with the provider active at upload time. If you index documents with one embedding model and later query them with another, retrieval quality can degrade. KubeOwl detects this mismatch and logs a warning, but the best fix is to re-index documents after switching embedding providers.
Safe cluster inspection with kubectl
The most important design decision in KubeOwl is that cluster inspection is read-only by default and enforced in code.
The kubectl_exec tool allows only:
get
describe
logs
top
Write-oriented and interactive commands are blocked, including exec, delete, apply, edit, patch, scale, cordon, drain, taint, label, annotate, port-forward, cp, attach, run, create, replace, rollout, autoscale, expose, set, and proxy.
Shell metacharacters such as pipes, redirects, command substitution, semicolons, and newlines are rejected before execution. This matters especially for the SSH path, where a command string eventually reaches a remote host.
The output is also sanitized before it reaches the LLM. Tokens, secrets, passwords, API keys, and long base64-like blobs are redacted. That does not make prompt injection impossible, but it reduces the blast radius and keeps accidental secret exposure out of the model context.
In practice, KubeOwl can inspect state like this:
get pods -n production
describe pod api-7f8c9b9d9c-2lq6m -n production
logs api-7f8c9b9d9c-2lq6m -n production --tail=100
top nodes
get pv,pvc -A
describe ingress web -n default
It cannot mutate the cluster. The final remediation remains a human decision.
LLM provider options
KubeOwl supports multiple providers:
| Provider | Typical use |
|---|---|
ollama | Fully local development and private troubleshooting |
ollama-cloud | A remote Ollama-compatible endpoint |
gemini | Cloud LLM with Gemini embeddings |
claude | Claude for reasoning, with local Ollama embeddings |
openai | OpenAI GPT models, with local Ollama embeddings |
The default path is local Ollama:
ollama pull qwen2.5:7b
ollama pull nomic-embed-text
This is a good starting point when you want runbooks and cluster output to stay on your own machine. Cloud providers can be useful when you want stronger reasoning or faster responses, but you should treat cluster output as sensitive operational data and configure access accordingly.
Local quickstart
For local development, clone the repository and create a Python 3.11 environment:
git clone https://github.com/cagatayuresin/kube-owl.git
cd kube-owl

python3.11 -m venv .venv
source .venv/bin/activate
pip install -r requirements.txt
Copy the example environment file:
cp .env.example .envFor the default Ollama setup, make sure the local models exist:
ollama pull qwen2.5:7b
ollama pull nomic-embed-text
Then start the app:
./start.shYou can also run the backend directly:
uvicorn backend.main:app --reloadOpen http://localhost:8000, upload one or more runbooks, confirm the Kubernetes connection status, and ask a question about the cluster.
If there is no kubeconfig and no active SSH session, KubeOwl returns an honest connection error for kubectl queries. There is no fake cluster mode.
Docker quickstart
Docker is the easiest way to run KubeOwl without installing the Python stack on the host:
git clone https://github.com/cagatayuresin/kube-owl.git
cd kube-owl

cp .env.example .env
docker compose up --build
The Compose setup exposes the app on port 8000, mounts ./data for ChromaDB, uploads, and SSH sessions, and mounts ./runbooks so starter runbooks remain editable from the host.
The container connects to host Ollama through:
OLLAMA_BASE_URL=http://host.docker.internal:11434On Linux, the Compose file also includes:
extra_hosts:
  - "host.docker.internal:host-gateway"
Configuration is injected through .env at runtime. The Dockerfile uses a multi-stage build, copies only the runtime application files, and runs the service as a non-root appuser.
Important configuration
Most settings live in .env. These are the ones I usually check first:
DEFAULT_PROVIDER=ollama
OLLAMA_BASE_URL=http://localhost:11434
OLLAMA_MODEL=qwen2.5:7b
OLLAMA_EMBED_MODEL=nomic-embed-text

KUBECONFIG_PATH=~/.kube/config
ENABLE_TERMINAL=false
API_KEY=
ALLOWED_ORIGINS=["http://localhost:8000"]
Set API_KEY before exposing the API outside your laptop or trusted lab network. When API_KEY is configured, /api/* endpoints require an X-API-Key header, except /api/health so container health checks continue to work.
The optional terminal endpoint is disabled unless ENABLE_TERMINAL=true. Even then, it accepts only validated read-only kubectl commands.
Remote cluster inspection over SSH
KubeOwl can run kubectl locally or over a saved SSH session. This is useful when your kubeconfig lives on a remote server, a bastion, or a small K3s node.
The SSH session feature stores connection profiles in data/sessions.json with file mode 0600. Passwords are supported, but key-based authentication is the better operational choice.
By default, unknown host keys are rejected. There is an SSH_AUTO_ADD_HOST_KEYS flag for throwaway labs, but it should not be used for production-like environments because it weakens host identity checks.
Example diagnosis flow
Imagine a user asks:
Pods in the production namespace keep restarting. What could be wrong?A useful KubeOwl path is:
- The supervisor identifies this as a compute issue.
- The compute specialist searches runbooks for restart, CrashLoopBackOff, OOMKilled, and exit-code guidance.
- The specialist checks pod state with
get pods -n production. - It inspects a failing pod with
describe pod. - It retrieves recent logs with
logs --tail=100. - It combines Events, logs, and runbook evidence into a diagnosis.
- It returns recommended next steps, not a blind one-line fix.
That last distinction is the whole point. In Kubernetes operations, the most useful answer is rarely “run this command immediately.” A better answer is: here is what the evidence suggests, here is the next safe command, here is what would confirm the hypothesis, and here is the remediation path if the hypothesis is true.
API examples
The UI is the main workflow, but the backend is also usable directly.
Health check:
curl http://localhost:8000/api/healthAsk the agent:
curl -X POST http://localhost:8000/api/agent/query \
  -H "Content-Type: application/json" \
  -d '{
    "query": "I am getting ImagePullBackOff in staging. What should I check?",
    "provider": "ollama",
    "session_id": "staging-imagepull"
  }'
Upload a runbook:
curl -X POST "http://localhost:8000/api/documents/upload?provider=ollama" \
  -F "file=@runbooks/imagepullbackoff.md"
If API_KEY is set, add:
-H "X-API-Key: your-api-key"Development and CI
KubeOwl is written in Python 3.11 and uses FastAPI, LlamaIndex, ChromaDB, Paramiko, and a vanilla JavaScript frontend. Development checks are intentionally practical for an operations tool:
pip install -e ".[dev]"
pre-commit install

ruff check .
ruff format --check .
mypy
bandit -c pyproject.toml -r backend
pytest
pip-audit -r requirements.txt --disable-pip --no-deps
The test suite is designed to run offline. LLM calls, embeddings, subprocess calls, SSH interactions, and ChromaDB storage are mocked or isolated, so CI can validate behavior without needing a real cluster or a real model endpoint.
The GitHub Actions workflow runs linting, format checks, type checks, Bandit, pytest with an 80 percent coverage gate, dependency audit, secret scanning, Docker build, and a Trivy image scan.
Operational boundaries
KubeOwl is best used as an operator assistant on a trusted network. A few boundaries are worth being explicit about:
- The API has no authentication by default. Set
API_KEYand use a real reverse proxy authentication layer before exposing it. - SSH session credentials are stored locally in
data/sessions.json; treat thedata/directory as sensitive. - Runbooks, command output, and chat history become prompt context. That is useful, but it is also a prompt injection surface.
- Read-only command validation limits cluster impact, but it does not turn LLM output into an authority. Human review still matters.
- If you switch embedding providers, re-index runbooks for better retrieval quality.
These constraints are intentional. The safest version of an AI operations assistant is not the one that can do everything. It is the one that is narrow, observable, auditable, and honest about what it can and cannot change.
When KubeOwl is useful
KubeOwl is useful when a team already has Kubernetes troubleshooting knowledge but wants a faster way to apply it during incidents. It is also a good learning tool for operators who want to see how runbooks, live cluster inspection, and multi-agent reasoning can work together without giving an AI system write access to the cluster.
Use it for diagnosis, triage, and guided investigation. Upload your runbooks, connect it to a local or remote cluster, ask specific questions, and let it collect the first layer of evidence. Then keep the final production action where it belongs: with the engineer operating the system.